

MARKETS ARE PRICING PEACE, BUT THE FED IS PRICING HIGHER RATES
Traders were bracing for a wider conflict. Now, they’re betting the worst is behind us. Oil has completely erased its war-driven rally. Politicians are debating how much military involvement the United States should even have in the region. Traders have aggressively removed the geopolitical premium that was built into markets during the recent tensions.
But while one major risk is disappearing, another is becoming increasingly difficult to ignore. Interest rate hike expectations are surging. The result is a market caught between two very different narratives. One is becoming more bullish. The other is becoming more bearish.
WASHINGTON IS SENDING MIXED SIGNALS ON IRAN
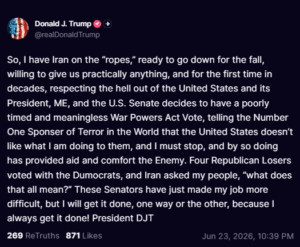
The Senate voted 50-48 to pass a War Powers Resolution aimed at limiting U.S. military involvement against Iran, marking one of the most significant congressional challenges to presidential war powers in decades.
For markets, the vote initially looked like another de-escalation signal. Lower conflict risk typically means lower oil prices, lower inflation pressure, and a more supportive environment for risk assets. However, Trump quickly pushed back against the vote, calling it “poorly timed and meaningless” while claiming Iran remains “on the ropes” and ready to make major concessions.
At the same time, reports suggest that increasingly hostile public rhetoric between U.S. and Iranian officials is beginning to complicate negotiations. The market has already priced many of the benefits of peace. Whether the negotiations can actually deliver them remains the biggest question.
OIL HAS COMPLETELY ERASED THE WAR PREMIUM
Crude oil has now fallen below $72 for the first time since March, fully reversing the rally that followed the recent Middle East tensions. The move reflects growing confidence that energy supplies will remain uninterrupted and that geopolitical risks are continuing to fade.
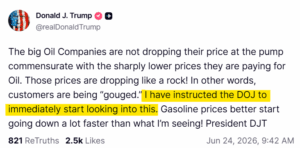
The decline has become so significant that Trump publicly criticized oil companies for failing to pass lower prices on to consumers. Trump said oil prices are “dropping like a rock” and announced that he has instructed the Department of Justice to investigate whether consumers are being overcharged at the pump.
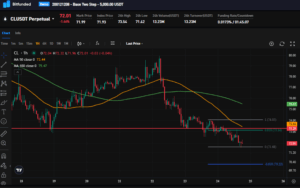
From a technical perspective, oil has broken below the key $73 support zone and remains below both the 50-day moving average near $73.4 and the 100-day moving average near $75.5.
The next major support sits near $71.7. A break below could expose the psychological $70 level. For now, sellers remain firmly in control.
THE FED IS BECOMING A BIGGER PROBLEM
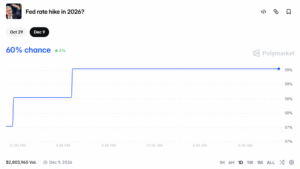
While traders are celebrating lower oil prices, interest rate expectations are moving sharply higher. Just one month ago, markets assigned roughly a 24% probability to a December rate hike. Today, those odds have surged to 77%.
Even more surprising, traders are now pricing a 25% probability that the Federal Reserve raises rates as soon as its July meeting. The shift has been dramatic. At the beginning of the year, markets expected multiple rate cuts. Now investors are debating whether the next move will be another hike. Higher-for-longer is officially back.
GOLD JUST FLASHED ITS BIGGEST WARNING SIGN SINCE 2022
XAU is quietly sending one of the strongest signals in the market. The metal has now fallen below its 200-day moving average by the largest margin since 2022. That matters because the 200-day moving average is widely viewed as one of the most important long-term trend indicators in financial markets.
The move reflects growing confidence that interest rates may remain elevated for much longer than previously expected. Technically, gold remains locked in a downtrend.
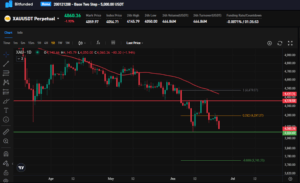
Price recently failed to reclaim resistance near $4,197 and continues trading below the major moving average near $4,437. The key support level remains near $4,025. A breakdown below support could open the door toward the next major downside target near $3,740.
Until buyers reclaim resistance, momentum remains firmly with sellers.
SILVER IS BREAKING DOWN TOO
XAG is showing even more weakness than gold. The metal has lost both its 100-period moving average near $66.6 and its 200-period moving average near $70.5, reinforcing the broader downtrend.
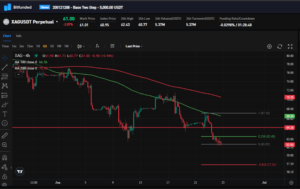
Price recently failed to hold above the important $64.3 support level and is now trading near $61.The next major support sits between $60 and $61. A break below that zone could expose the next downside target near $57.3.
BITCOIN IS STUCK BETWEEN PEACE AND THE FED
BTC continues trading in one of the most important ranges of the month. On one side, falling oil prices and easing geopolitical tensions should support risk assets. On the other, markets are aggressively pricing higher interest rates. So far, neither side has gained control.
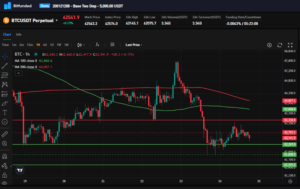
It remains below both the 100-period moving average near $63.7K and the 200-period moving average near $64K. Those levels represent the most important resistance zone on the chart. Support remains near $62.3K. A successful breakout above resistance would strengthen the recovery narrative and improve overall market structure. A loss of support would expose the next major level near $61.5K.
JTO IS STARTING TO STABILIZE
While much of the market remains focused on Bitcoin, JTO is beginning to show signs of stabilization after its recent correction.The token continues benefiting from its position as the dominant liquidity and trading hub within the Solana ecosystem.
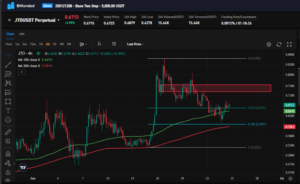
Technically, it is attempting to build a base above key support levels while challenging resistance near $0.66-$0.67. A breakout above that zone could open the door toward the larger $0.72-$0.75 resistance area. As long as support near $0.60 holds, the broader structure remains constructive.
ETHFI IS SHOWING EARLY SIGNS OF LIFE
It is one of the few Ethereum ecosystem tokens outperforming today. After defending support near $0.28, price has rebounded sharply and is attempting to reclaim the important $0.40 resistance level.
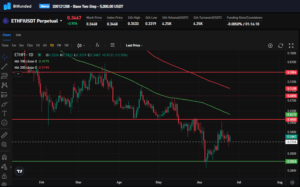
A successful breakout would improve momentum and potentially open the door toward the $0.47-$0.52 region where major moving averages sit. While the broader trend remains under pressure, ETHFI is beginning to show relative strength compared to many other altcoins.
MELANIA REMAINS ONE OF THE WEAKEST CHARTS IN CRYPTO
Not every token is showing strength. MELANIA continues trading below all major moving averages and remains firmly stuck in a long-term downtrend.
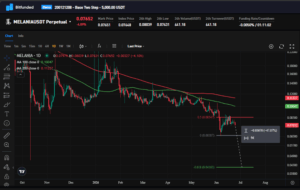
The most important support remains near $0.066. If that level breaks, the next major downside target sits near $0.042. That represents roughly 45% downside from current levels.
Should U.S.-Iran negotiations begin deteriorating again and risk sentiment weaken, MELANIA remains one of the charts most vulnerable to another wave of selling.
WHAT TO WATCH
- Developments surrounding U.S.-Iran negotiations
- Oil and whether crude can hold above $71.7 support
- Changes in July and December rate hike expectations
- Gold’s battle with the $4,025 support level
- Bitcoin’s attempt to reclaim the $63.7K-$64K resistance zone
The market has spent the last two weeks aggressively pricing peace.Now it must decide whether lower geopolitical risk is enough to offset a Federal Reserve that is becoming increasingly hawkish.
TRADE GLOBAL VOLATILITY WITH BITFUNDED
Markets are moving fast, and volatility continues creating opportunities for prepared traders.
👉 Access funded trading accounts
👉 Keep your personal capital protected
👉 Scale positions with confidence
👉 Take advantage of market-moving events
START TRADING WITH BITFUNDED
THE BITFUNDED TEAM