
The cryptographic trading field displays frequent intense and unpredictable movements which lead prices either to rise or drop swiftl The fluctuating nature of the market requires traders to have solutions which provide them effective market navigation tools. The tools of market depth and order books supply necessary data regarding marketplace supply and demand levels along with liquidity measurements.
The knowledge of these tools enables traders to base decisions on solid evidence while recognizing trading possibilities and execute their risk management more effectively.
The guide examines order books and market depth features together with their reading methods while explaining their role in improving trading strategies regardless of trading experience.
What Is an Order Book?
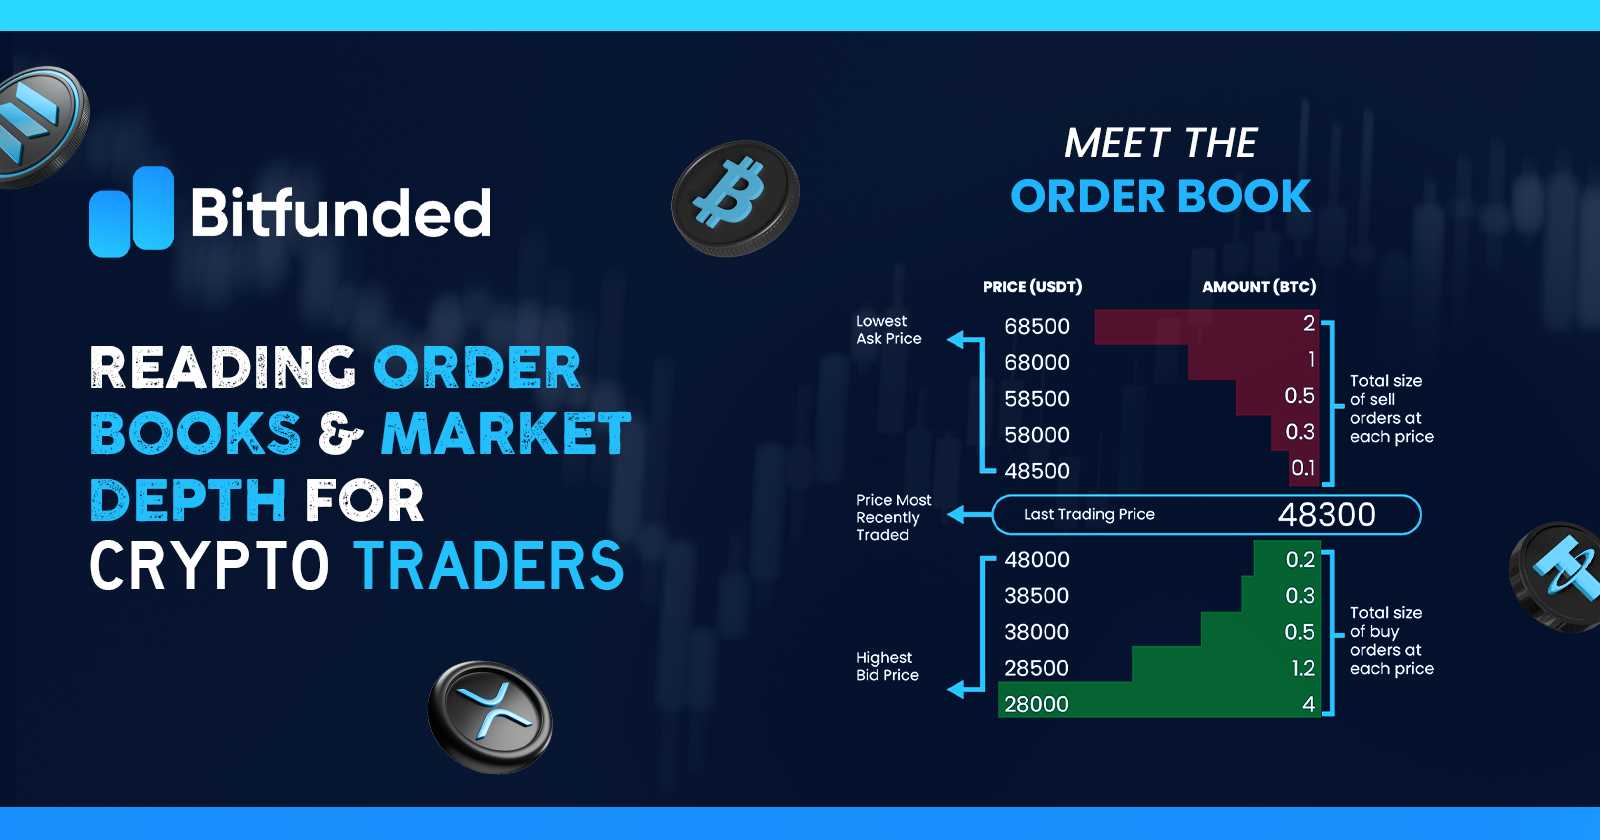
Exchange platforms maintain ongoing real-time lists of active buy and sell orders which display the cryptocurrency pair orders including BTC/USDT as well as ETH/BTC. The trading platform functions as an auction log which presents the maximum asking prices for purchases and the minimum prices for sales at any given time. The order book shows every trading request comprising price and quantity and cumulative value of requests.
- Traders express their buying or selling willingness at specific values with USDT or another cryptocurrency functioning as the exchange medium.
- Quantity: The volume of the cryptocurrency (e.g., 0.5 BTC) at that price level.
- The total order amount at all prices propagates up to each specific point which order books display commonly.
The BTC/USDT order book starts with $60,000 bids amounting to 2 BTC followed by $60,050 asks matching 1.5 BTC. All bids appear on the order book at descending values (starting from the highest prices first) while ask orders rise by ascending value (beginning from the lowest prices first). As orders happen the structure updates automatically to represent the present market supply and demand equilibrium.
Structure of an Order Book
| Side | Price (USDT) | Quantity (BTC) | Total (USDT) |
| Ask | 60,050 | 1.5 | 90,075 |
| Ask | 60,100 | 0.8 | 48,080 |
| Bid | 60,000 | 2.0 | 120,000 |
| Bid | 59,950 | 1.2 | 71,940 |
The spread, the difference between the highest bid ($60,000) and lowest ask ($60,050), is $50 in this example. A narrow spread suggests high liquidity, meaning trades can occur with minimal price impact. A wide spread indicates lower liquidity, where trades might cause larger price shifts.
What Is Market Depth?
Market depth measures the total volume of buy and sell orders at various price levels beyond the best bid and ask. It’s a gauge of a market’s liquidity—how easily large trades can be executed without significantly moving the price. High market depth means many orders across a range of prices, providing stability. Low depth, often seen in smaller altcoins, can lead to volatility, as even modest trades can shift prices.
Market depth is typically visualized through a depth chart, a graph plotting cumulative order volumes against price levels. The chart has two sides:
- Buy Side (Green): Shows cumulative buy orders, sloping upward as prices decrease.
- Sell Side (Red): Shows cumulative sell orders, sloping upward as prices increase.
The midpoint of the chart, where the buy and sell lines meet, represents the current market price and the bid-ask spread. Large clusters of orders, known as “buy walls” or “sell walls,” can indicate potential support or resistance levels. For instance, a buy wall at $59,500 for ETH/USDT might suggest strong demand, making it harder for the price to drop below that level (BeInCrypto).
Why Order Books and Market Depth Matter
Order books and market depth offer a window into market dynamics, revealing:
- Supply and Demand: The balance of buy and sell orders shows whether buyers or sellers are dominating, hinting at potential price movements.
- Liquidity: High depth means trades can be executed with minimal slippage (price changes during execution), while low depth warns of volatility risks.
- Support and Resistance: Large order clusters can act as barriers, stabilizing prices at certain levels.
- Market Sentiment: Imbalances in order volumes can signal bullish or bearish trends, helping traders anticipate shifts.
For beginners, these tools reduce reliance on guesswork, providing data-driven insights. For experienced traders, they refine entry and exit points, especially in fast-moving markets. However, they’re not foolproof—large orders can be manipulative, and external factors like news can override order book signal.
How to Read an Order Book
To read an order book effectively, focus on its key components:
- Bids and Asks: On most exchanges, bids appear in green on the left, asks in red on the right. The highest bid is the best price a seller can get, and the lowest ask is the best price a buyer can get.
- Spread: A small spread (e.g., $10) indicates a liquid market, while a larger spread (e.g., $100) suggests lower liquidity, increasing the risk of slippage.
- Volume: Check the quantity at each price level. A bid for 5 BTC at $60,000 shows stronger demand than one for 0.1 BTC.
- Order Flow: Watch how orders change. Rapid additions or cancellations can signal market activity or manipulation.
For example, if the BTC/USDT order book shows a bid at $60,000 for 10 BTC and an ask at $60,020 for 3 BTC, the market leans bullish due to stronger buying pressure. If a large sell order appears at $60,050, it might cap upward movement, acting as resistance.
How to Interpret Market Depth
Market depth charts make order book data visual and intuitive. Here’s how to use them:
- Identify Walls: A buy wall (large green area) at a lower price, like $59,800, suggests strong support, as many traders are ready to buy. A sell wall at $60,200 indicates resistance, as sellers dominate.
- Assess Liquidity: A steep depth chart (sharp slopes) means low depth and higher volatility risk. A gradual slope indicates high depth, suggesting stability.
- Spot Imbalances: If the buy side is thicker than the sell side, it may signal upward pressure, and vice versa.
For instance, on Kraken’s BTC/USD market, a depth chart showing a large buy wall at $59,500 and thin sell orders above $60,000 might suggest a breakout if buying pressure persists.
Practical Applications in Trading
Order books and market depth can enhance trading strategies in several ways:
- Finding Entry and Exit Points: Place buy orders near strong bid levels (support) or sell orders near ask clusters (resistance) to optimize pricing.
- Executing Large Trades: Choose price levels with high depth to minimize slippage. For example, selling 10 BTC at a price with 50 BTC in bids ensures better execution.
- Detecting Manipulation: Large orders that appear and disappear quickly may be “spoofing” to fake demand or supply. Monitor order book changes to avoid traps.
- Scalping Opportunities: In high-liquidity markets, traders can profit from small spread movements by quickly buying at the bid and selling at the ask.
- Risk Management: Avoid trading in low-depth markets during volatile periods, as slippage can erode profits.
Example Scenario
Suppose you’re trading ETH/USDT. The order book shows:
- Highest bid: $2,000 for 20 ETH.
- Lowest ask: $2,005 for 10 ETH.
- Depth chart: A buy wall at $1,990 (50 ETH) and a sell wall at $2,020 (30 ETH).
You might:
- Buy at $2,000, expecting support from the $1,990 wall.
- Set a sell target at $2,015, just below the $2,020 resistance.
- Use a stop-loss below $1,990 to limit risk if the support breaks.
Practical Tips for Traders
To make the most of order books and market depth, consider these strategies:
- Start with Major Pairs: Practice with high-liquidity pairs like BTC/USDT or ETH/USDT, which have deeper order books and clearer patterns.
- Use Depth Charts: Platforms like TradingView offer depth charts that simplify analysis. Check them alongside order books.
- Monitor Real-Time Changes: Watch for sudden order cancellations or large new orders, which can signal whale activity or market shifts.
- Combine with Other Tools: Use technical indicators (e.g., RSI, moving averages) or news analysis to confirm order book signals.
- Practice on Demo Accounts: Test your skills on exchanges’ demo platforms to build confidence without risking capital.
- Beware of Spoofing: Large orders may be placed to manipulate perceptions. If they vanish quickly, they’re likely not genuine.
Mastering order books and market depth is a vital skill for cryptocurrency traders, offering a clear view of market dynamics and liquidity. By understanding how to read these tools, traders can identify support and resistance, gauge sentiment, and execute trades with precision. While not infallible, they provide a data-driven edge when combined with technical and fundamental analysis. Start practicing on your preferred exchange, use demo accounts to build confidence, and keep learning to navigate the ever-evolving crypto markets successfully.